

TL;DR - Key Takeaways
- Capability is not plateauing. Industry shipped 90%+ of notable frontier models in 2025, and on SWE-bench Verified, models went from ~60% to near 100% of the human baseline in a single year.
- The U.S.–China model gap has effectively closed. The two have traded the lead repeatedly since early 2025; as of March 2026 the top U.S. model leads by just 2.7%. China still leads on publications, citations, and patent output.
- The buildout is staggering — and concentrated. Global AI compute capacity has grown ~3.3× per year since 2022 to 17.1M H100-equivalents; the U.S. hosts 5,427 data centers (10× any other country); and one foundry (TSMC) makes nearly every leading AI chip.
- AI has a "jagged frontier." A model can win gold at the International Math Olympiad yet read an analog clock correctly only ~50% of the time. Robots succeed at just 12% of real household tasks.
- Responsible AI is falling behind capability. Documented AI incidents rose to 362 (from 233 in 2024), and safety-benchmark reporting remains spotty even as capability reporting is near-universal.
- The money doubled — and pooled in the U.S. U.S. private AI investment hit $285.9B, ~23× China's $12.4B, with generative AI alone growing 200%+.
- People are getting huge value, mostly for free. Generative AI reached 53% adoption in three years (faster than the PC or the internet), and U.S. consumer surplus reached an estimated $172B/year.
- Productivity is up where entry-level jobs are down. Gains of 14–26% in support and coding sit alongside a ~20% drop in employment for U.S. developers aged 22–25.
- Experts and the public live in different worlds. On AI's impact on jobs, 73% of experts are positive vs 23% of the public — a 50-point gap.
📚 Source: the 2026 AI Index Report from the Stanford Institute for Human-Centered AI (HAI) — a 425-page, nine-chapter measurement of where AI actually stands. Every chart below is reproduced from the report. This post is my distilled summary, not the original; read the full thing if a number matters to your work.
📑 Want the whole report, not the highlights? I also published the full report in LLM-readable Markdown — all nine chapters with every one of the 340 charts embedded inline. For direct ingestion, append
.mdto the URL: /blog/stanford-ai-index-report-2026-llm-readable.md.
What the AI Index is
Once a year, Stanford HAI publishes the closest thing the field has to an annual physical: a sprawling, data-first audit of AI across research, technical performance, responsible AI, the economy, science, medicine, education, policy, and public opinion. It's deliberately measured rather than breathless — which is exactly why it's worth reading when the discourse swings between "AGI is here" and "it's all a bubble."
The 2026 edition lands on one organizing idea: AI is advancing on almost every axis at once, but the advances are uneven, concentrated, and increasingly hard to see inside. Here's the report in nine moves.
1. Capability is accelerating, not plateauing
The headline chart scales a basket of benchmarks against human performance. The pattern is relentless: tasks that took years to approach the human line — image recognition, reading comprehension, language understanding — are now joined by PhD-level science questions, competition mathematics, multimodal reasoning, and autonomous software engineering, all crossing or closing on the human baseline.
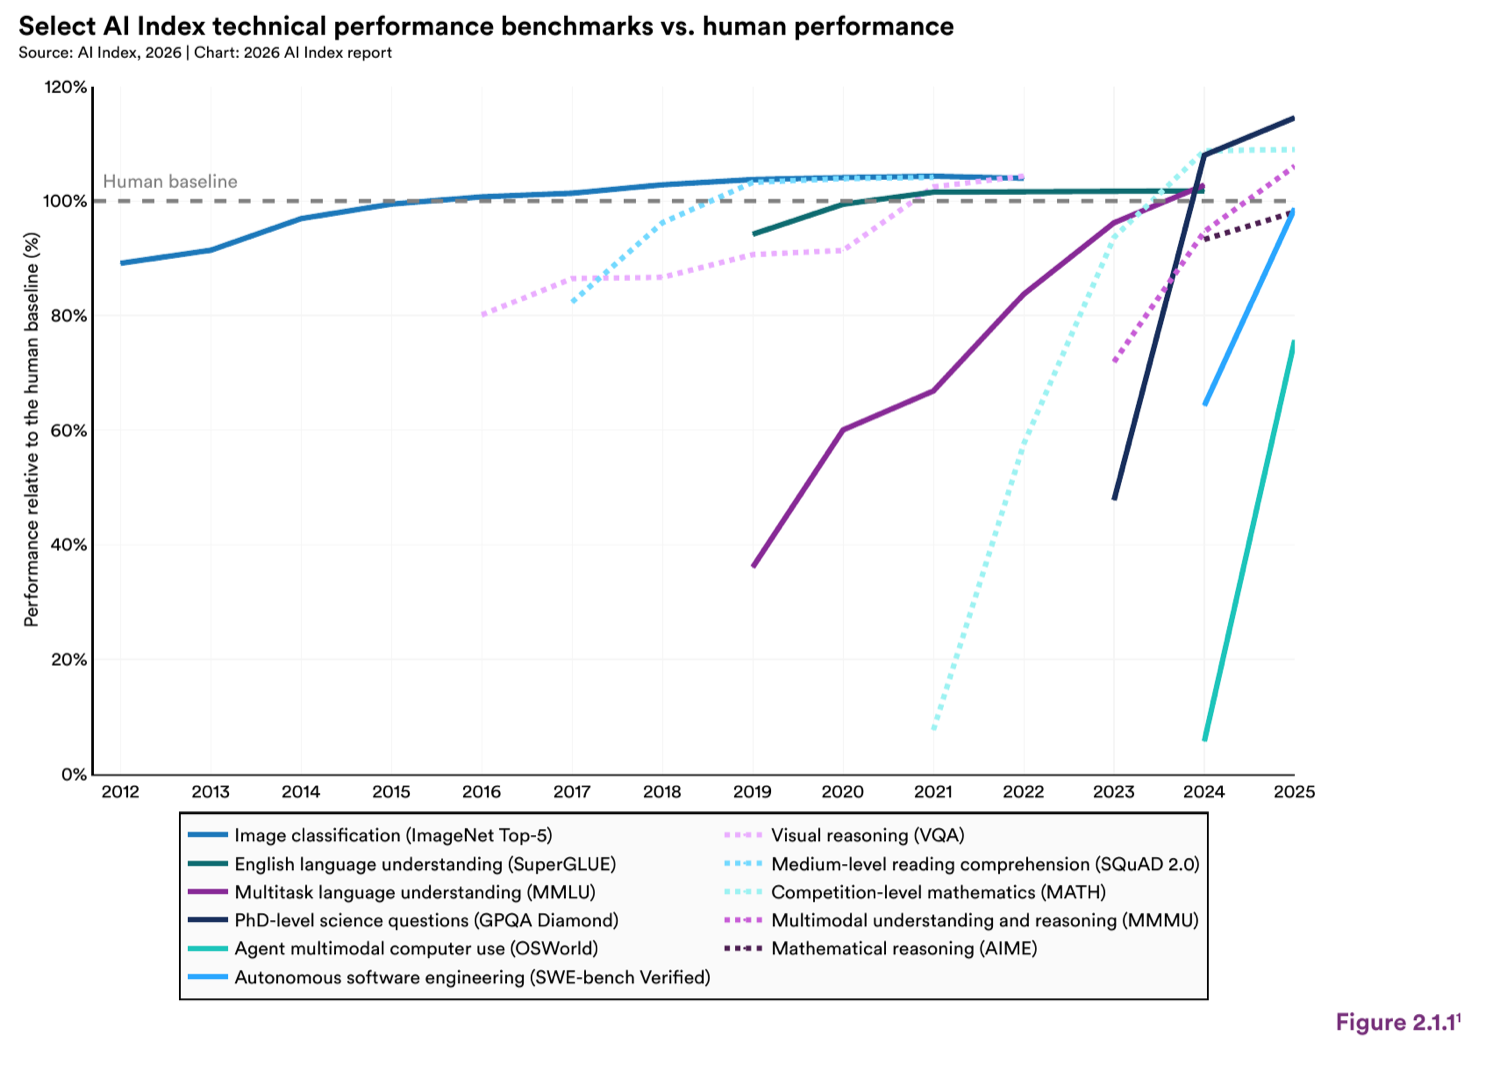
The speed is the story. Models gained 30 percentage points in a single year on Humanity's Last Exam — a test built to be hard for AI — and benchmarks designed to last for years are now saturating in months. On SWE-bench Verified, performance climbed from ~60% to near the human baseline in twelve months.
But capability is jagged, not uniform:
- Gemini Deep Think won a gold medal at the 2025 International Mathematical Olympiad, working end-to-end in natural language within the time limit.
- The same class of model reads analog clocks correctly only ~50% of the time (50.6% on ClockBench, vs 90.1% for humans).
- AI agents leapt from ~12% to 66% task success on OSWorld (real computer tasks), yet still fail roughly 1 in 3 structured attempts.
- Robots succeed at only 12% of real household tasks, even as they hit 89.4% in lab simulations.
The lesson: superhuman in narrow, structured domains; surprisingly brittle the moment the world gets messy.
2. The U.S.–China race is now a photo finish
For years there was a comfortable gap between the top U.S. model and everyone else. That gap is gone. U.S. and Chinese models have traded the lead multiple times since early 2025 — DeepSeek-R1 briefly matched the best U.S. system in February 2025 — and as of March 2026 the top U.S. model leads by just 2.7%.
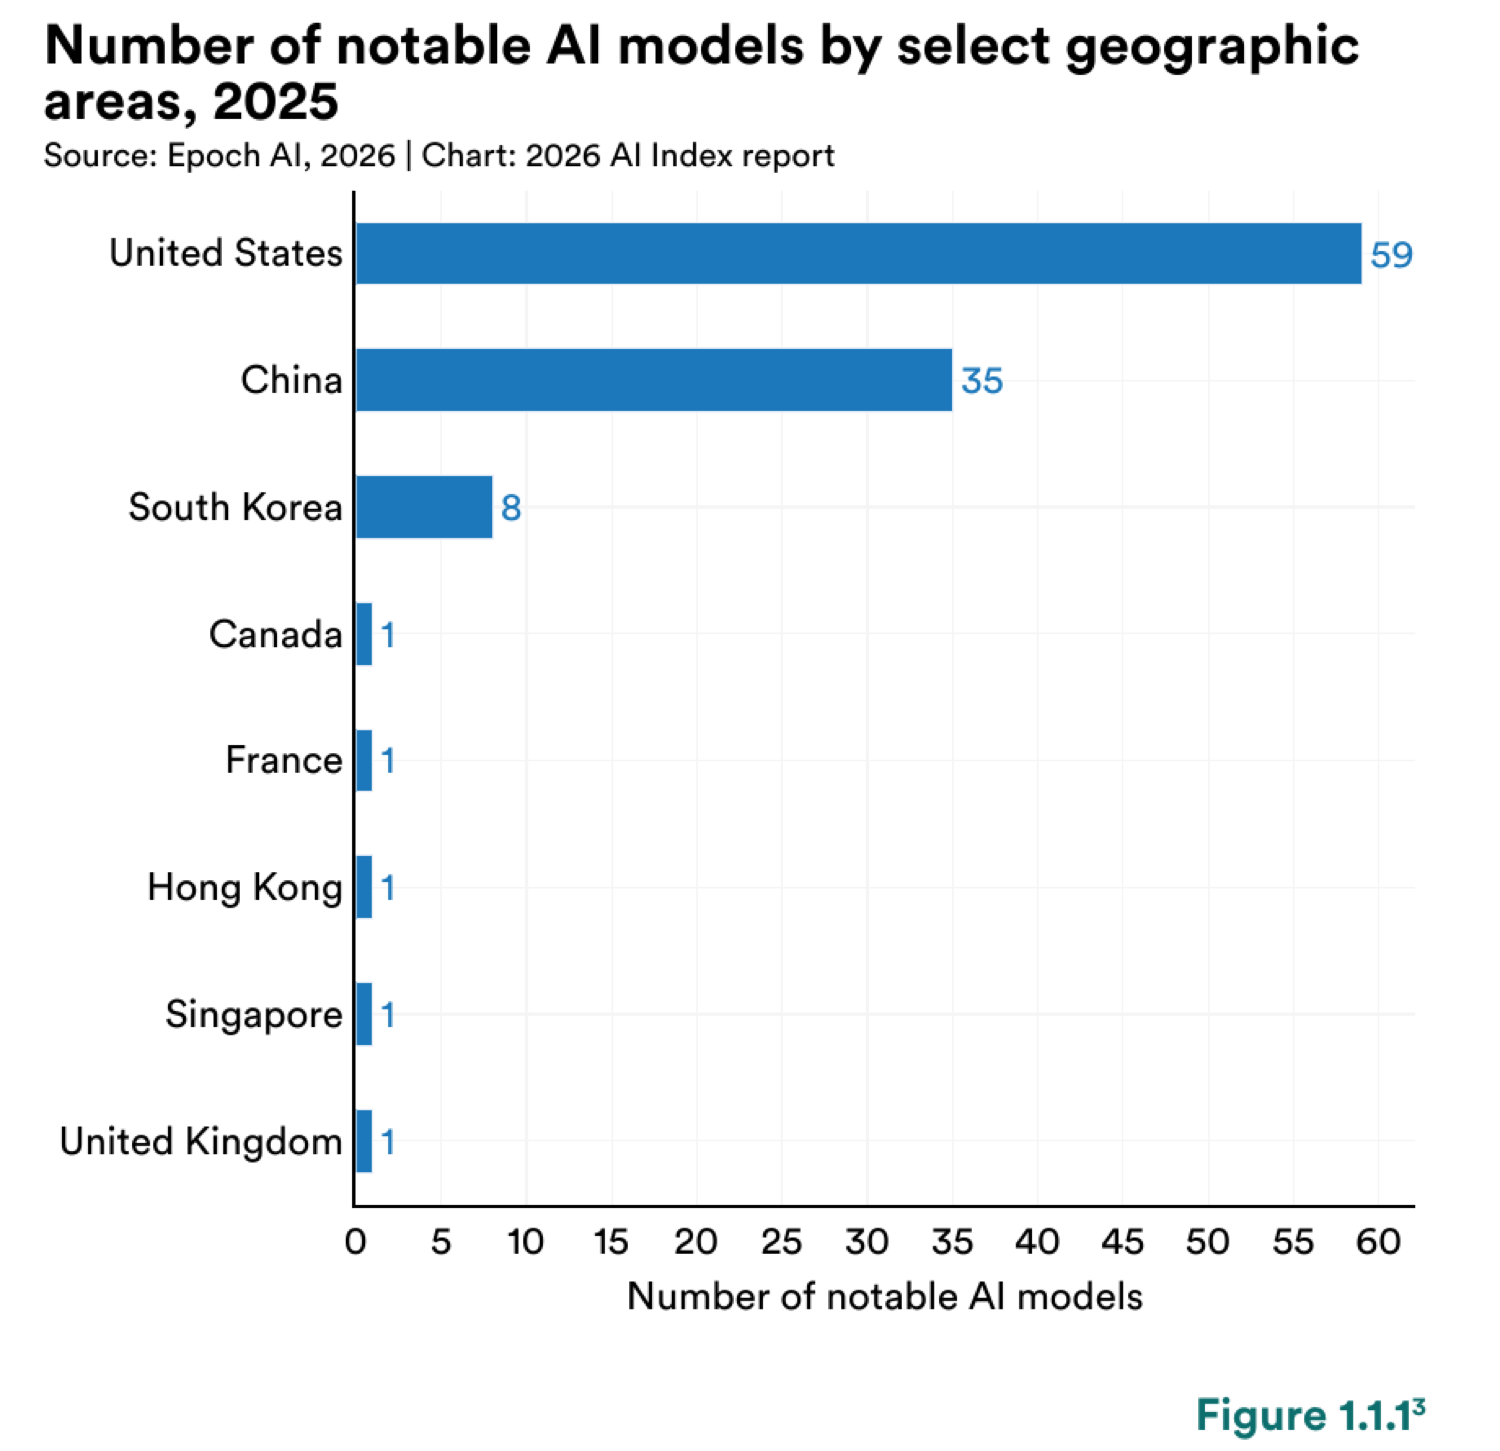
The two countries lead in different ways:
| Dimension | Leader |
|---|---|
| Notable models released (2025) | U.S. — 59 (China 35, South Korea 8) |
| Higher-impact patents, top-tier models | United States |
| Publication volume, citations, patent grants | China |
| Industrial robot installations | China (54% of the global total) |
| AI patents per capita | South Korea |
Two undercurrents matter. First, open-weight models reopened a gap after nearly closing in 2024 — the top closed model now leads the best open one by 3.3%. Second, open-source participation is globalizing: contributions from the rest of the world now outpace Europe and approach the U.S. on GitHub.
3. The buildout — and its footprint
None of this is free. Global AI compute capacity has grown about 3.3× per year since 2022, reaching roughly 17.1 million H100-equivalents, with Nvidia supplying over 60% of it.
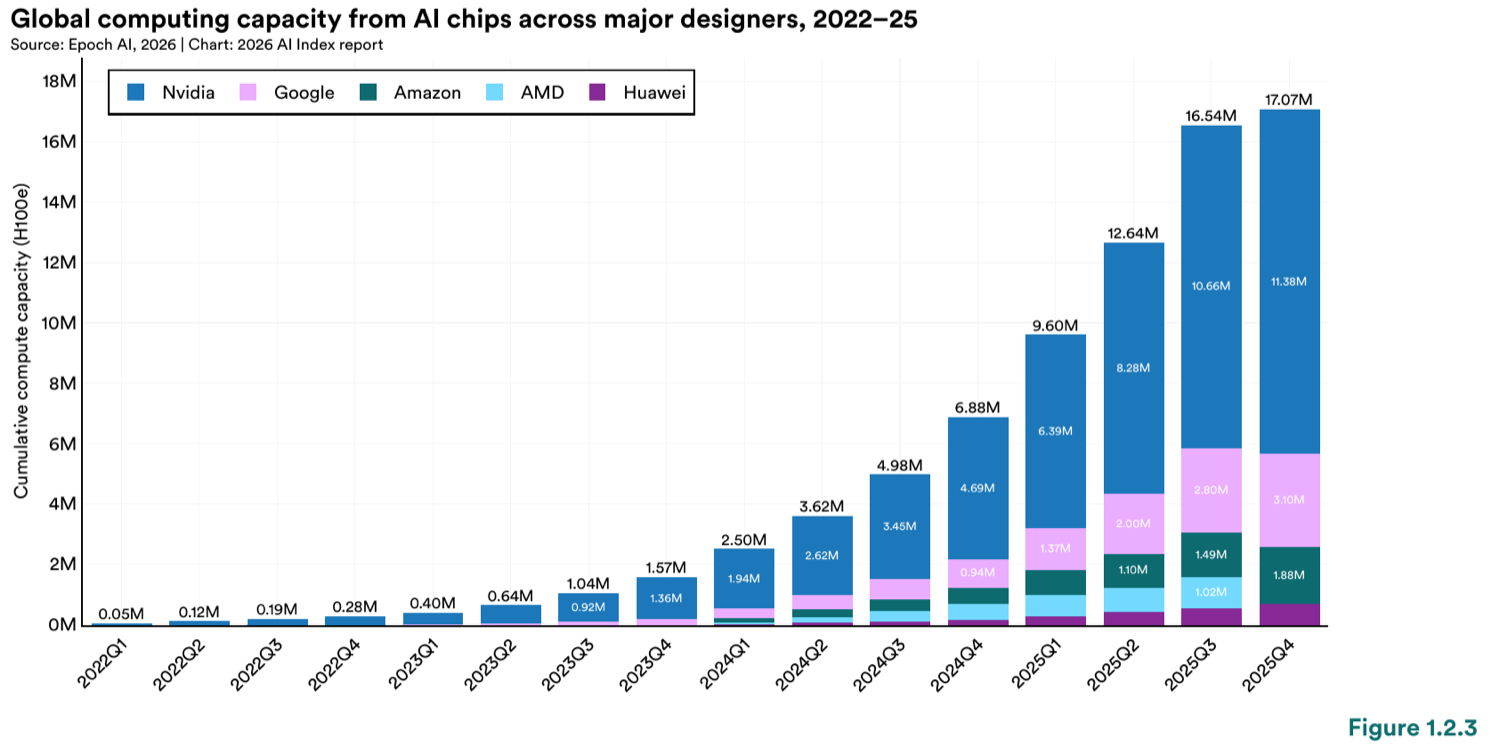
That compute has to live somewhere, and it overwhelmingly lives in America. The U.S. hosts 5,427 data centers — more than 10× any other country — and consumes more energy for them than any other nation.
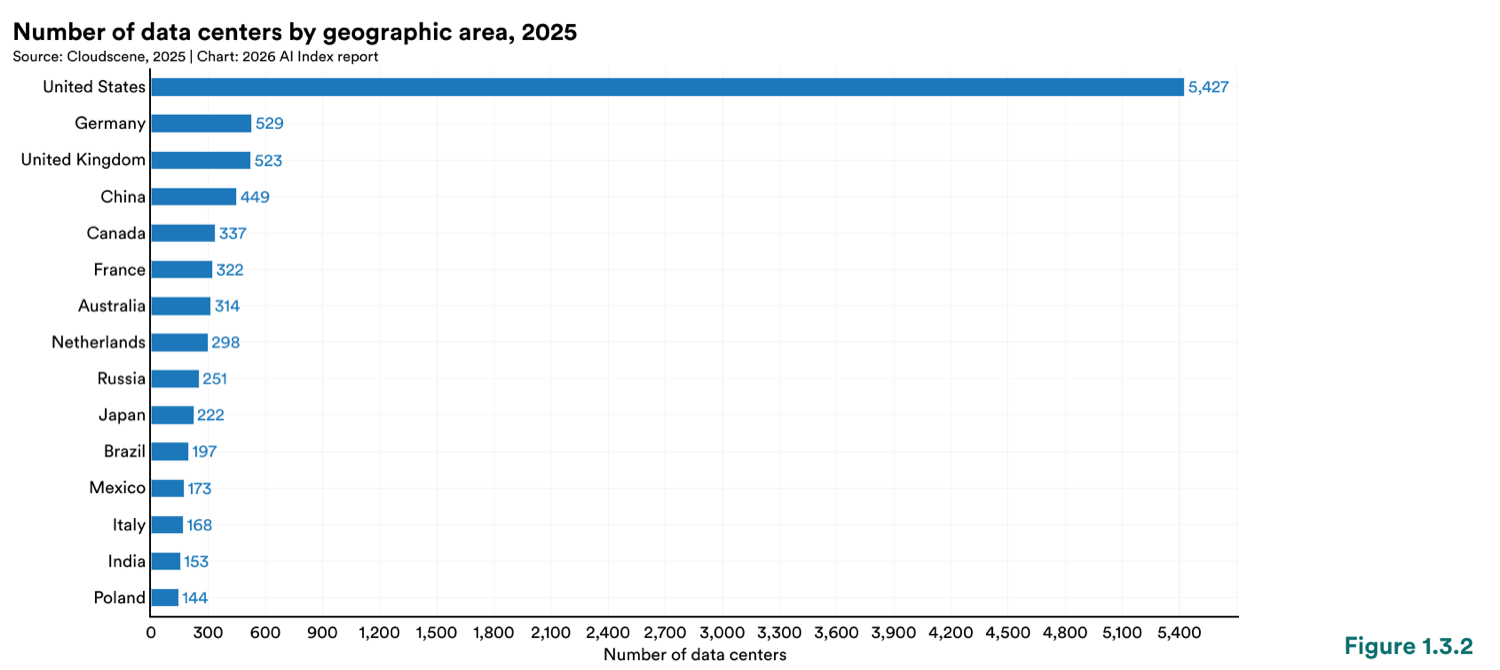
Underneath the whole stack sits a single point of failure: one Taiwanese foundry, TSMC, fabricates almost every leading AI chip. (A TSMC-U.S. expansion did begin operating in 2025.)
The environmental bill is now legible, too:
- Grok 4's estimated training emissions: 72,816 tons of CO₂-equivalent.
- AI data center power capacity reached 29.6 GW — comparable to New York State at peak demand.
- Annual GPT-4o inference water use alone may exceed the drinking-water needs of 1.2 million people.
4. Responsible AI is not keeping pace
Capability reporting is now near-universal; responsibility reporting is not. Almost every frontier lab publishes capability benchmarks, but responsible-AI benchmark reporting remains sparse — and the harms are showing up in the record.
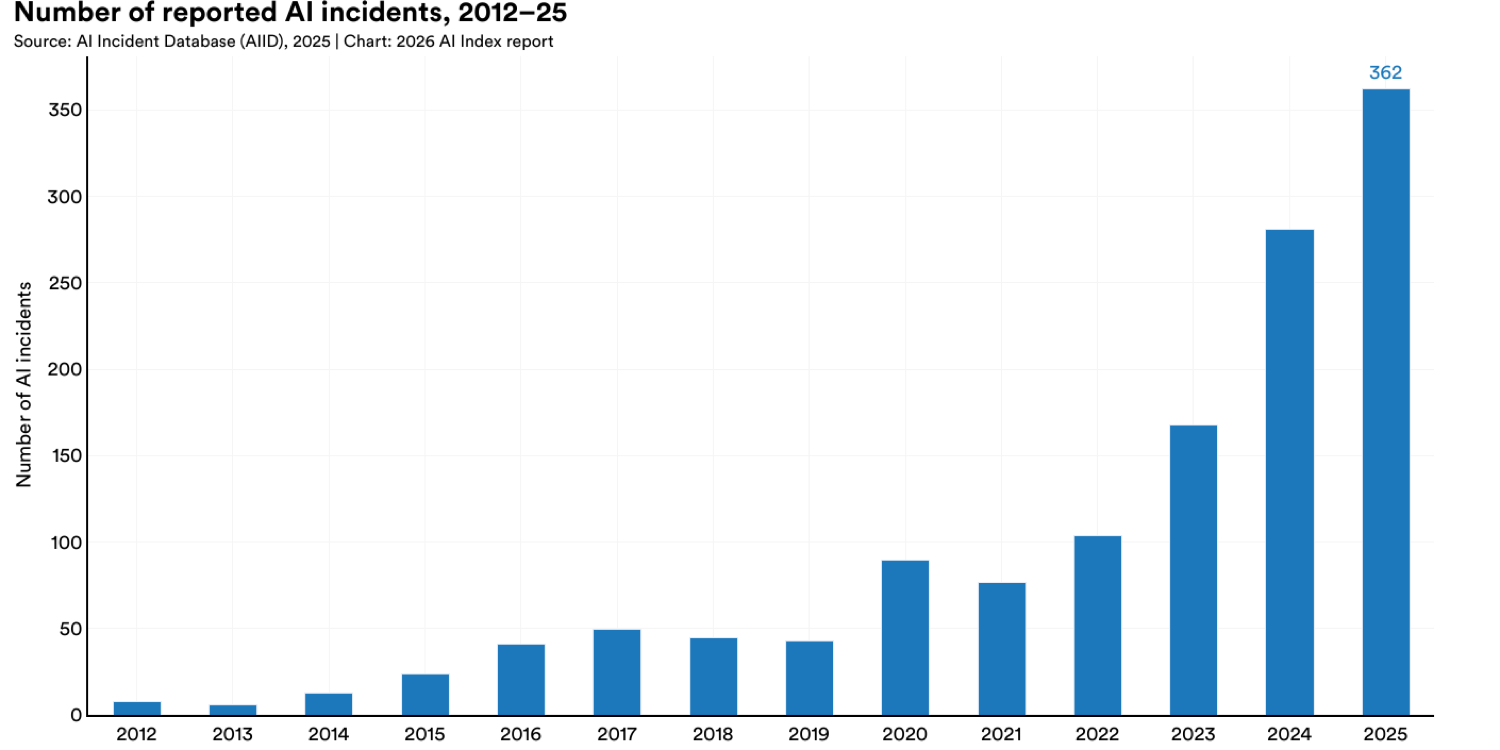
Documented AI incidents climbed to 362 in 2025, up from 233 the year before. Other warning signs from the chapter:
- Transparency went backwards. The average Foundation Model Transparency Index score fell from 58 to 40, with the biggest gaps around training data and post-deployment impact.
- Safety is conditional. Models that earn "Good"/"Very Good" safety ratings under normal use degrade under adversarial jailbreak prompts.
- The dimensions fight each other. New research finds that improving one responsible-AI property (say, safety) can measurably degrade another (say, accuracy) — and the tradeoffs are poorly understood.
5. The money: record investment, narrowly held
Global corporate AI investment more than doubled in 2025, and generative AI captured nearly half of all private funding. But the capital is concentrated to an extreme degree.
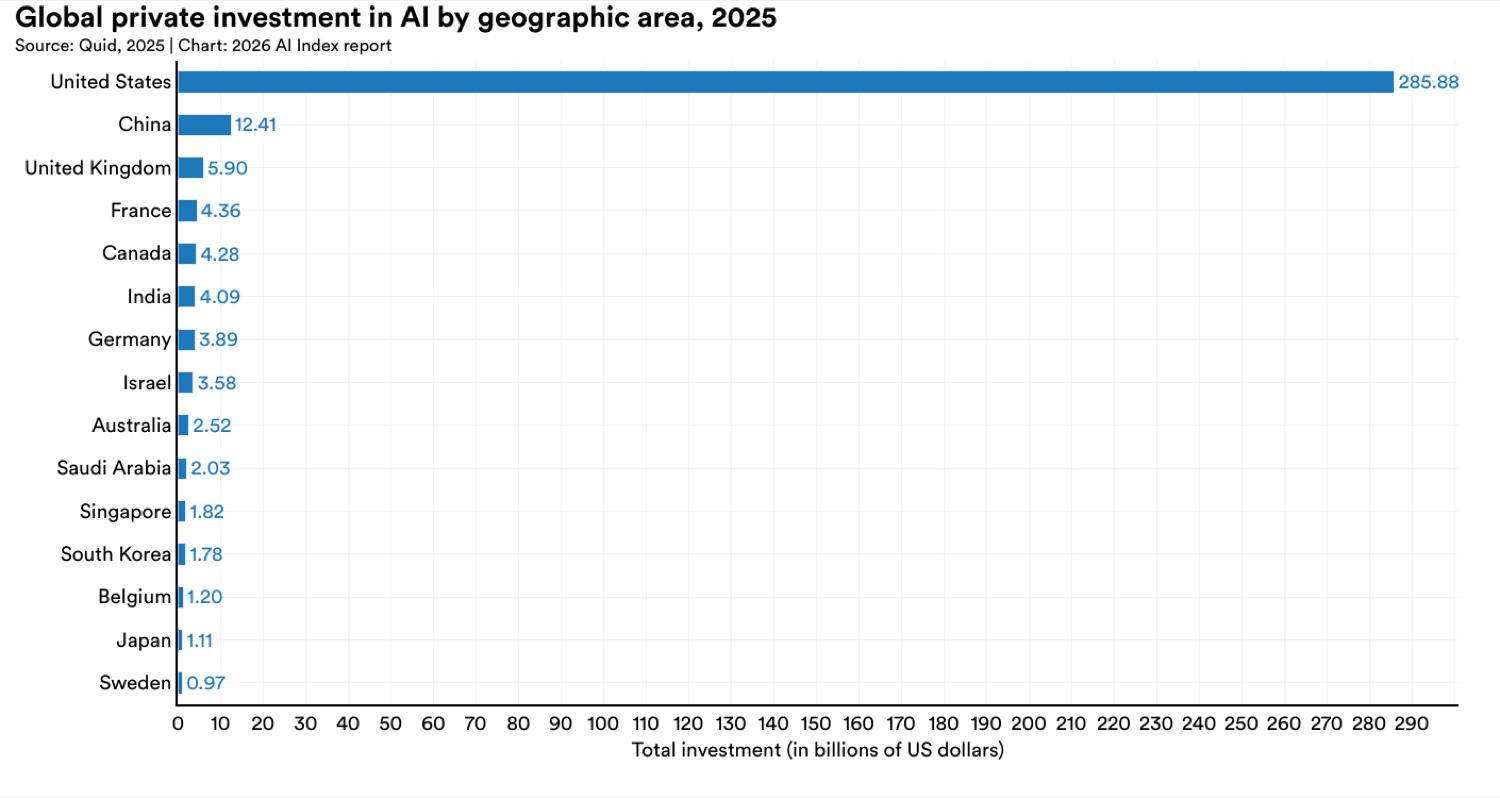
The U.S. committed $285.9 billion in private AI investment — about 23× China's $12.4 billion — and funded 1,953 new AI companies, more than 10× the next country. (Private figures likely understate China, whose state guidance funds don't show up here.)
There's a catch buried in the lead, though: the U.S. is losing its talent magnet. The number of AI researchers and developers moving to the U.S. has dropped 89% since 2017 — and 80% in the last year alone. Capital is pouring in; people are increasingly staying put elsewhere.
6. What AI is actually worth to people
Investment and revenue measure value to producers. The 2026 report makes a serious attempt to measure value to users — and it's enormous, precisely because most of these tools are free.
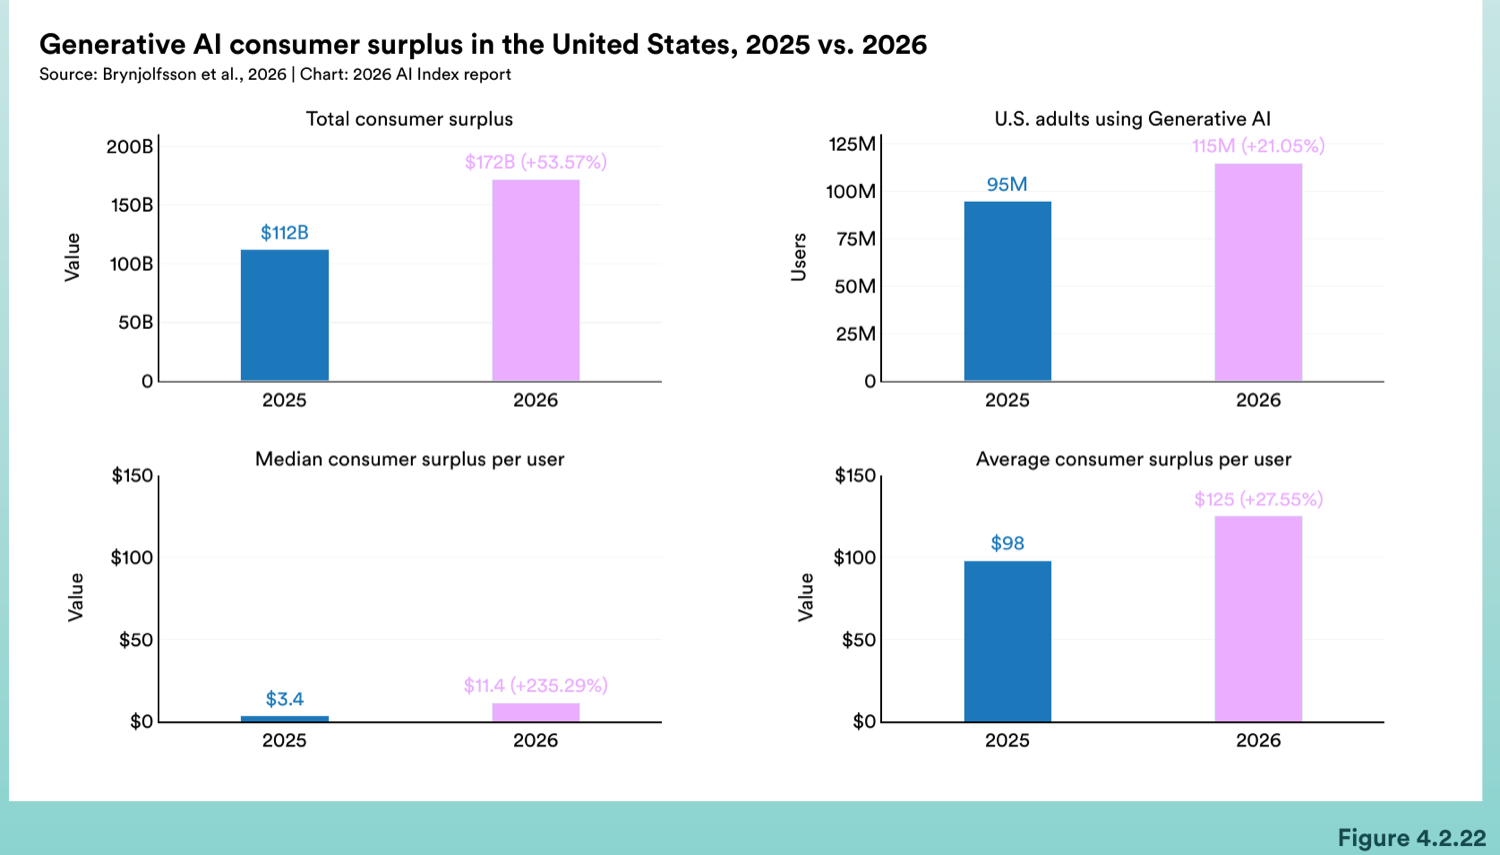
Estimated U.S. consumer surplus from generative AI grew to $172 billion a year (from $112B), with the median value per user tripling from $3.40 to $11.40. Adoption is the fastest of any modern technology — 53% of the population in three years, faster than the PC or the internet — though it's wildly uneven: Singapore (61%) and the UAE (54%) outpace expectations, while the U.S. ranks 24th at 28.3%. Inside organizations, adoption hit 88%, but AI agent deployment is still in the single digits across nearly every business function.
The jobs picture is uneven, and it rhymes
Productivity gains are real but concentrated in structured work: 14–15% in customer support, 26% in software development, up to 50% in marketing output, with weak or negative effects on judgment-heavy tasks. And the labor-market signal is appearing first exactly where the productivity gains are clearest:
- Employment for U.S. software developers aged 22–25 fell nearly 20% from 2024, even as headcount for older developers kept growing.
- One-third of organizations expect AI to reduce their workforce in the coming year.
7. AI across industries: the sector sweep
The 2026 report makes one thing clear: AI's impact is no longer evenly spread "across the economy" in the abstract — it's landing in specific industries at very different speeds and with very different evidence behind it. Here's the sector-by-sector view.
| Industry | What 2025 looked like | Headline data point |
|---|---|---|
| Software & engineering | The clearest productivity gains — and the first labor-market cracks | +26% productivity; −20% employment for devs aged 22–25 |
| Healthcare & life sciences | Fast adoption of AI scribes; thin clinical evidence | 258 FDA-authorized AI devices; up to 83% less note-writing time |
| Finance, legal & professional | Strong but not yet reliable on high-stakes reasoning | 60–90% on tax, mortgage, corporate finance, legal benchmarks |
| Manufacturing & robotics | Robots excel in the lab, fail in the home | China = 54% of industrial robots; robots win 12% of household tasks |
| Transportation & AVs | Autonomous ride-hailing hit real scale | Waymo ~450k weekly trips; Apollo Go 11M driverless rides (+175%) |
| Media, marketing & creative | Generative output and world-modeling video | +50% marketing output; Veo 3 simulates physics it wasn't trained on |
| Science & research | Smaller, specialized models beating giants | A 111M-param protein model beat the prior leaders |
Software & engineering
This is where AI's measured value is most concrete — and where the disruption is showing first. Productivity studies report ~26% gains in software development, and coding agents now post 70%+ on SWE-bench Verified. But the report's starkest labor signal is here too: employment for U.S. developers aged 22–25 fell nearly 20% from 2024 even as headcount for older developers grew. AI agent deployment, though, is still in the single digits across nearly every business function — the tooling is ahead of the org charts.
Healthcare & life sciences
Clinical adoption is racing ahead of clinical evidence. AI scribes that draft notes from patient visits saw broad 2025 uptake, with physicians reporting up to 83% less time writing notes, lower burnout, and one system citing a 112% ROI. A multi-agent diagnostic system (Microsoft's orchestrator paired with OpenAI's o3) scored 85.5% on hard published cases vs 20% for unaided physicians, and AI-generated summaries now top 84–92% of health-related Google searches. Yet the FDA authorized 258 AI medical devices in 2025 mostly through pathways that skip new trials — only 2.4% were backed by randomized-trial data, and a review of 500+ clinical AI studies found just 5% used real clinical data.
Finance, legal & professional services
AI is pushing into high-stakes professional work, scoring 60–90% on evaluations in tax, mortgage processing, corporate finance, and legal reasoning. But these are exactly the domains where reliability matters most, and the top 15 models are separated by as little as 3 percentage points — competent, not yet dependable.
Manufacturing & robotics
The robotics story is a tale of two environments. In simulation, robotic manipulation hit 89.4% on RLBench; in real homes, robots succeed at just 12% of tasks. On the factory floor, China installed 54% of the world's industrial robots in 2024 (up from 51.1%), widening its lead as several major markets — the U.S., Germany, Italy — declined.
Transportation & autonomous vehicles
Autonomy reached genuine scale in 2025. Waymo ran roughly 450,000 weekly trips across five U.S. cities (~2,500 robotaxis), and in China Apollo Go completed 11 million fully driverless rides, up 175% year over year. Deployments still cluster in favorable-weather cities with remote human fallback.
Media, marketing & creative
Generative AI's biggest measured productivity jump is in marketing (+50% output), and video models crossed a notable threshold: Google DeepMind's Veo 3, tested across 18,000+ generated clips, simulated buoyancy and solved mazes without being trained to — early signs of models learning how the world behaves.
Science & research
Two patterns dominate the science chapters. First, bigger isn't always better: a 111-million-parameter protein model (MSAPairformer) beat the prior leaders on ProteinGym, and a 200-million-parameter genomics model (GPN-Star) outperformed one with 40 billion parameters. Frontier models now beat the average human chemist on ChemBench — yet score below 20% on replicating astrophysics papers. Virtual-cell models (Evo 2, STATE, AlphaGenome) and end-to-end AI weather pipelines (Aardvark; FourCastNet 3 runs a 60-day forecast in under 4 minutes) arrived, and the first fully AI-generated paper was accepted at a peer-reviewed workshop. Unlike general-purpose AI, most science models come from academic and government collaborations, not industry.
8. Policy, education, and a divided public
AI sovereignty has become a defining policy theme: national strategies are spreading fastest among countries that had none five years ago, and state-backed AI supercomputing is rising (Europe and Central Asia went from 3 clusters to 44 between 2018 and 2025). The EU AI Act's first measures took effect in February 2025, while the U.S. moved to remove regulatory barriers.
Education is lagging the technology. Over 80% of U.S. high-school and college students now use AI for schoolwork, but only half of middle and high schools have AI policies, and just 6% of teachers say those policies are clear. New AI PhDs in the U.S. and Canada rose 22% — and, reversing a decade-long trend, all of that growth went to academia rather than industry.
And the public and the experts simply do not agree about where this goes.
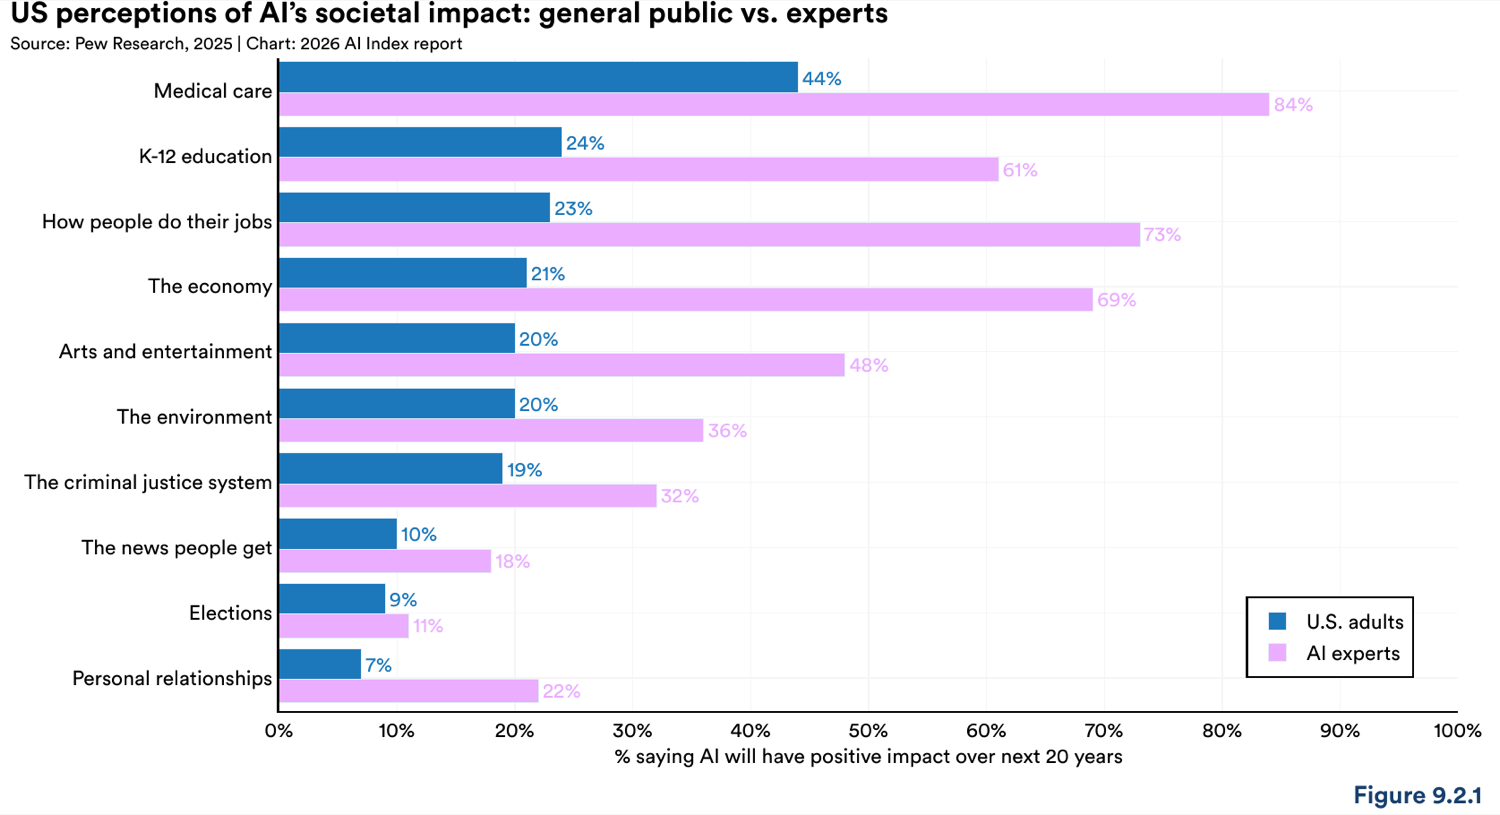
On whether AI will improve how people do their jobs, 73% of experts are positive versus just 23% of the public — a 50-point chasm that repeats for the economy (69% vs 21%) and medical care (84% vs 44%). Trust in institutions to manage AI is fragmented: the U.S. reported the lowest trust in its own government to regulate AI (31%), and globally the EU is trusted more than the U.S. or China to do it.
The whole report in one sentence
AI in 2026 is more capable, more adopted, and more valuable than ever — and simultaneously more concentrated, less transparent, and less evenly governed than its boosters admit. The capability curve is vertical; the responsibility, talent, and trust curves are not. That divergence — not any single benchmark — is the real headline.
Conclusion
If you only remember three things from the 2026 AI Index:
- The frontier is jagged. Don't reason about AI as uniformly "smart." It is superhuman at structured tasks and startlingly weak at others — design around both edges.
- The constraints have moved. The bottlenecks are no longer just model quality; they're compute, energy, chips, talent, and trust, and all five are concentrated in a handful of hands.
- Value is outrunning governance. Consumers are getting hundreds of billions in surplus while incident counts rise and transparency falls. The interesting work of the next year is closing that gap.
Read the full 2026 AI Index Report for the underlying data, methodology, and the chapters I compressed here — it's free, and the appendices are where the real nuance lives.
Last Updated: June 2026
Source: Maslej et al., Artificial Intelligence Index Report 2026, Stanford Institute for Human-Centered AI. All figures and charts © Stanford HAI, reproduced here for summary and commentary.