
TL;DR - Key Takeaways
- WebMCP Debugger is an open-source Chrome DevTools extension that gives you a Network-panel-like view into every
window.aiandnavigator.modelContextinteraction on any web page - Monkey-patching in MAIN world — the extension intercepts
LanguageModel.create,prompt,promptStreaming, and allmodelContextmethods without modifying page code - Three-layer architecture — MAIN world interceptor, ISOLATED world bridge, and background service worker pass events to a React-based DevTools panel
- Real-time tool tracking — see registered WebMCP tools, inspect their JSON schemas, and execute them manually from the panel
- Timeline and sessions — chronological event log with filtering, plus per-session prompt/response threads with streaming visualization
- Available now — requires Chrome 146+ with
chrome://flags/#webmcp-testingenabled; install by loading thedist/folder as an unpacked extension
Why I Built This
If you've been following the WebMCP standard or experimenting with Chrome's built-in window.ai (Prompt API / Gemini Nano), you've probably hit the same wall I did: there's no way to see what's actually happening.
You register a tool with navigator.modelContext.registerTool() — did it work? An AI agent calls your tool — what arguments did it pass? A promptStreaming() call starts returning chunks — are they accumulating correctly?
The browser's console gives you console.log and breakpoints, but AI interactions are asynchronous, multi-step, and often involve streaming. What I wanted was something closer to the Network panel — a chronological, filterable, inspectable view of every AI event happening on the page.
So I built one.
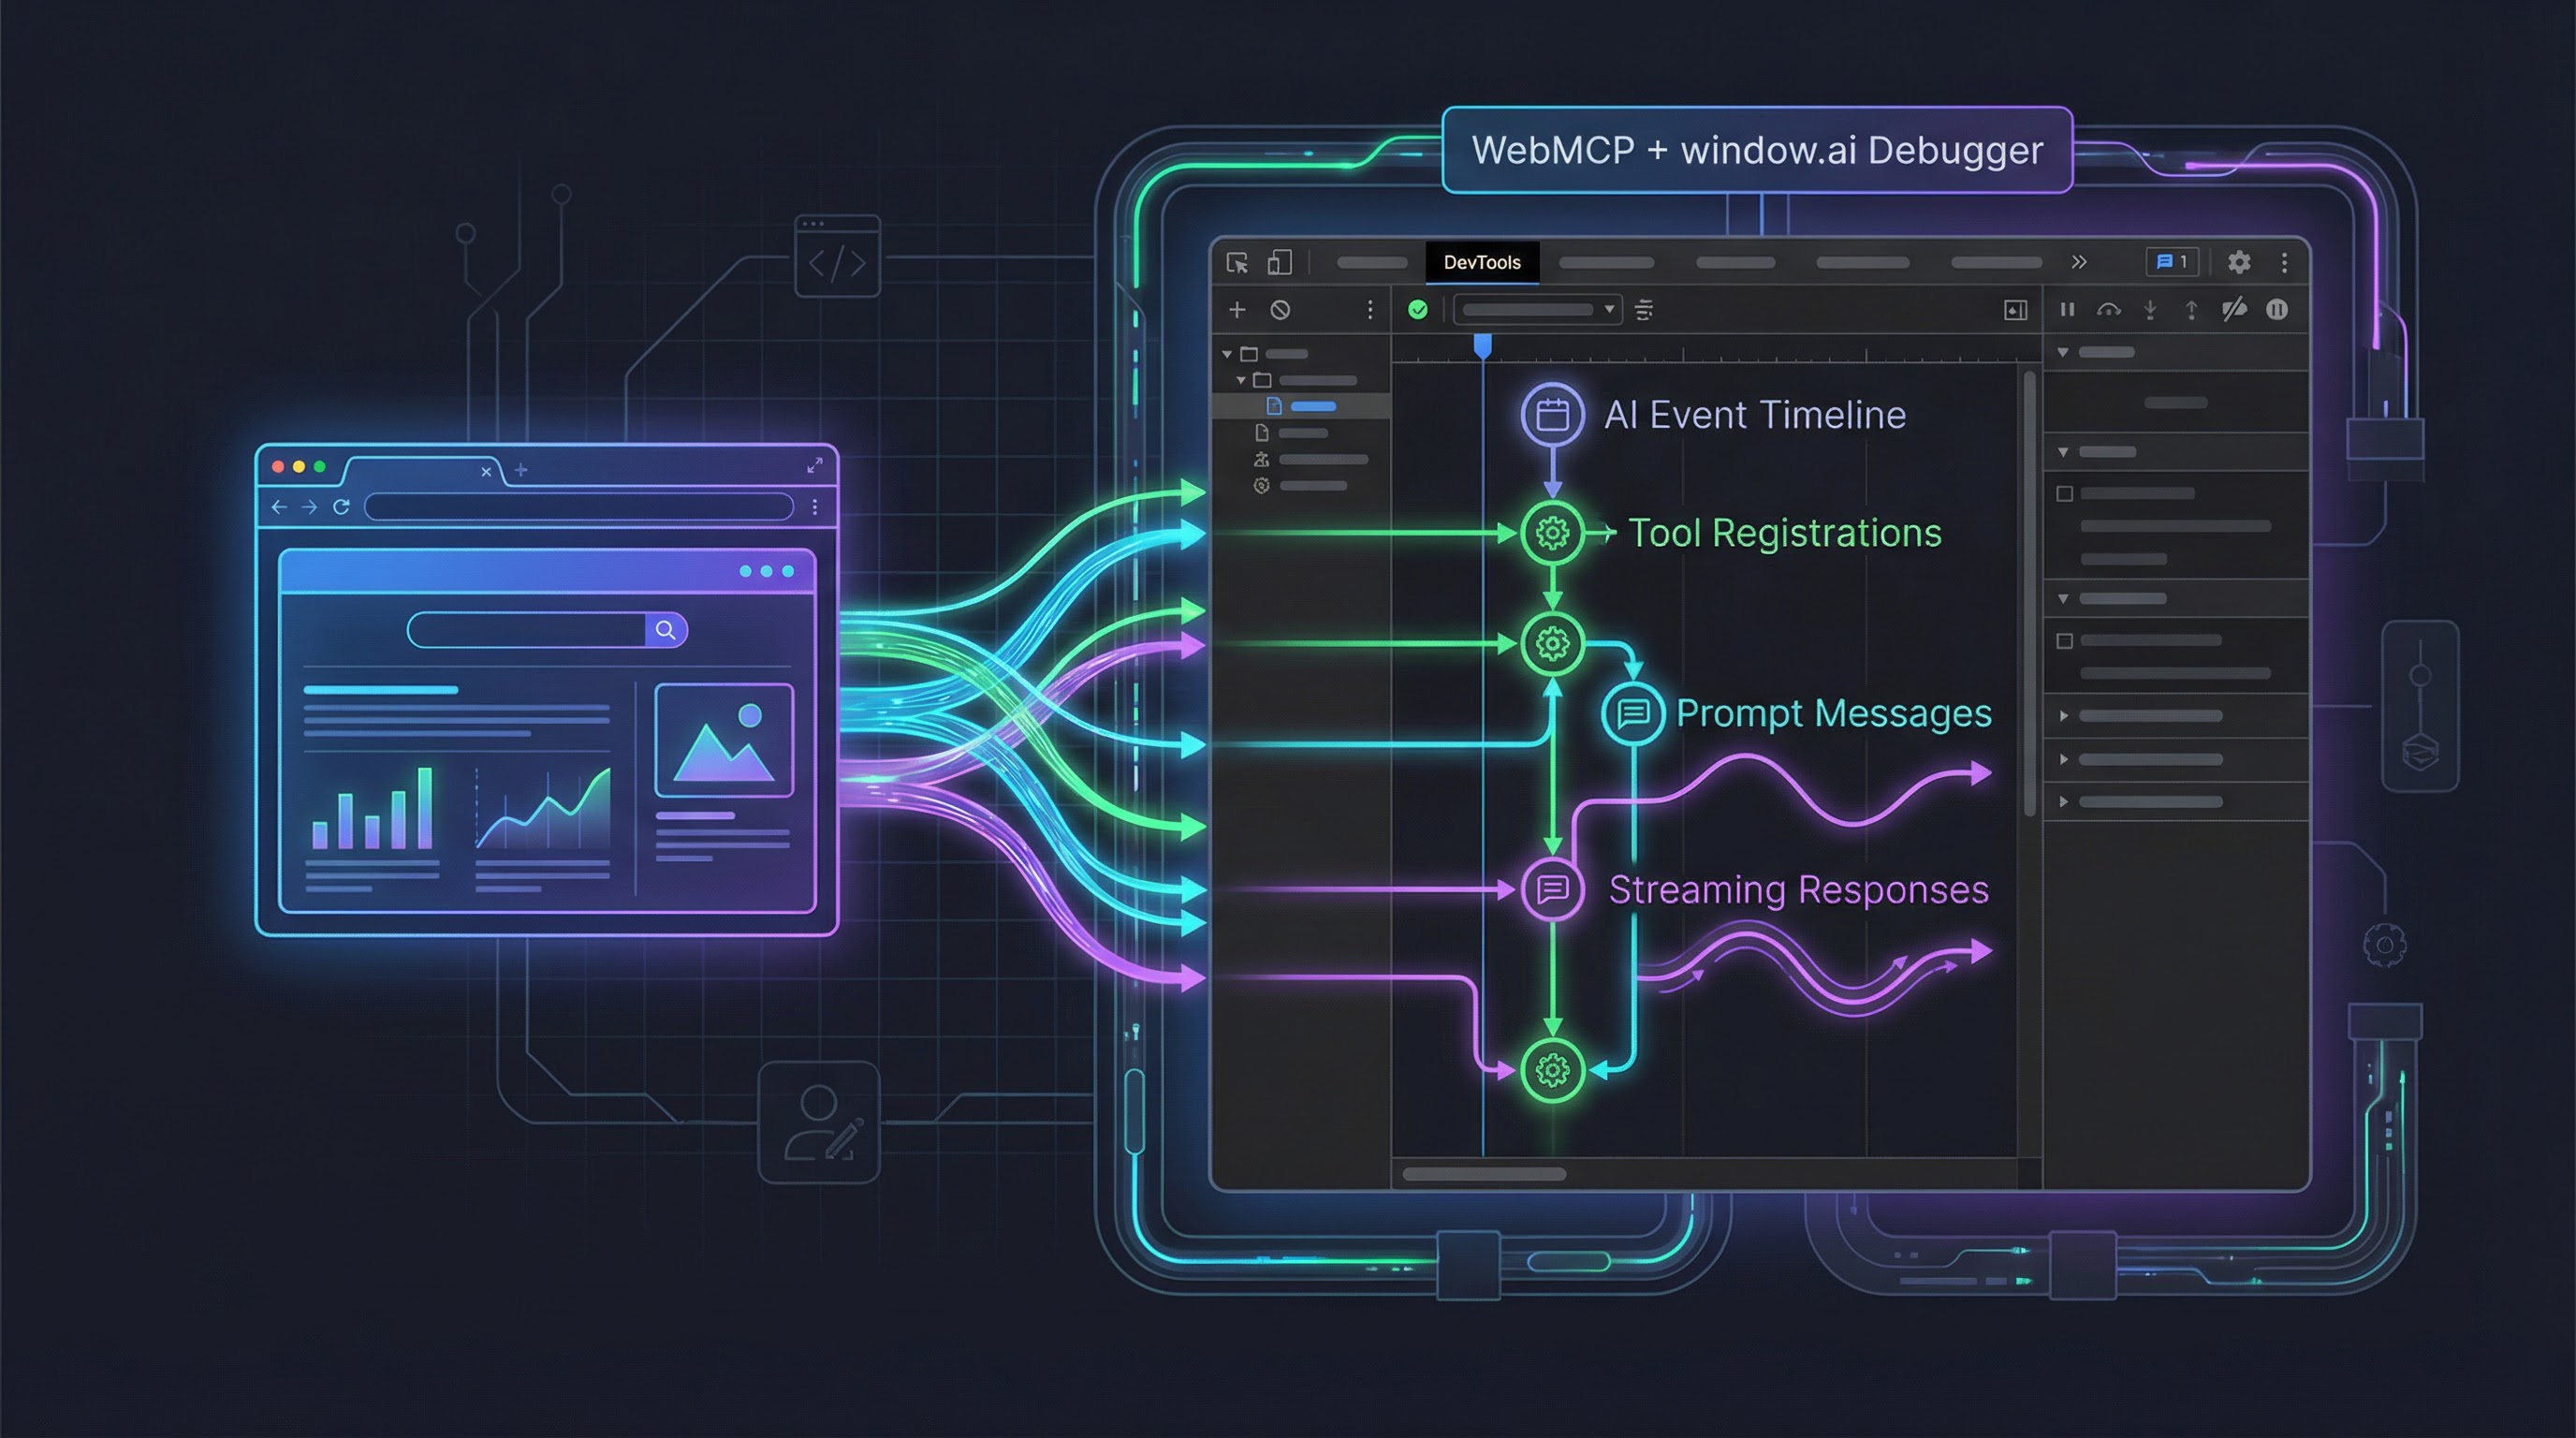
What It Does
WebMCP Debugger adds a new panel to Chrome DevTools. Open DevTools on any page running WebMCP or window.ai code, and you get a real-time dashboard of all AI activity.
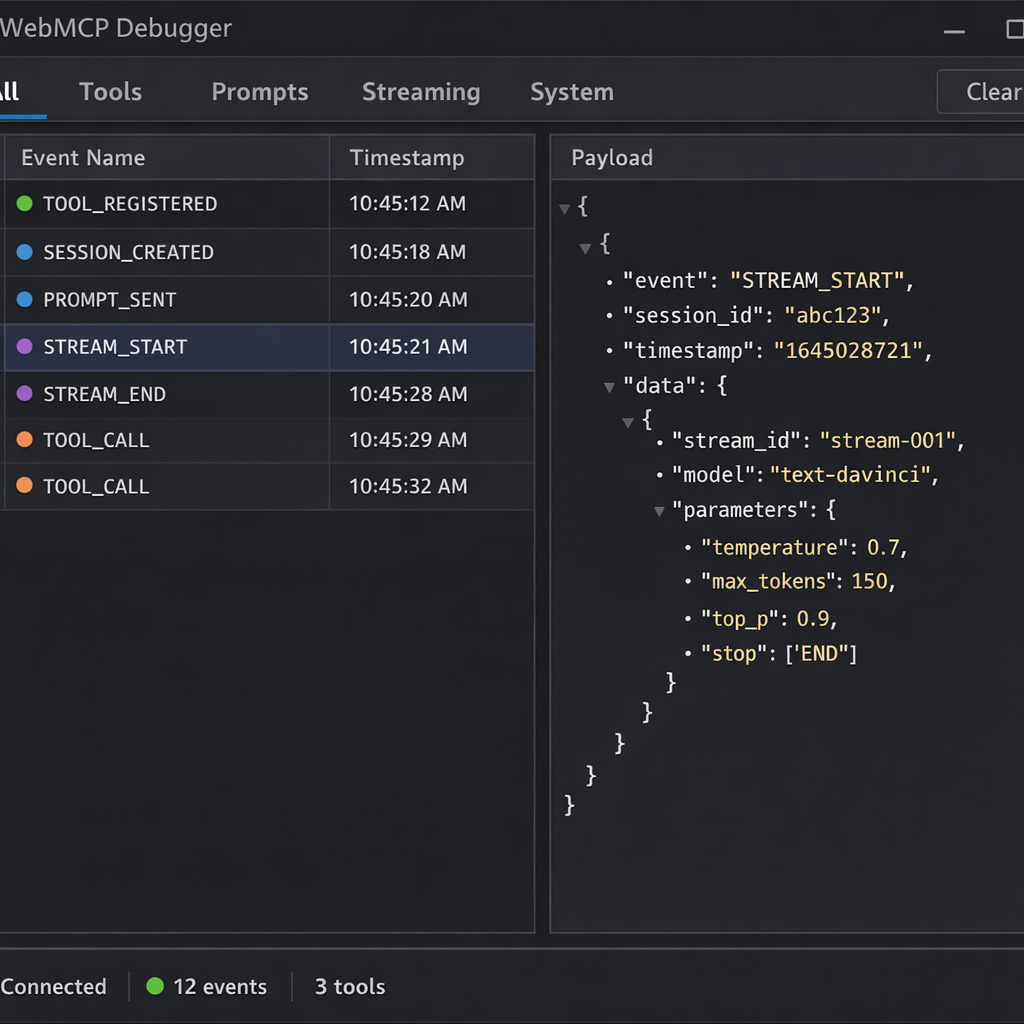
Timeline View
Every AI event gets logged chronologically — tool registrations, prompt sends, streaming chunks, tool calls, tool results, context clears, page reloads. You can filter by event category (Tools, Prompts, Streaming, System) and click any entry to inspect its full payload.
Tool Discovery and Execution
The panel derives the current set of registered tools from the event history, accounting for unregistrations, provideContext replacements, and page reloads. For each tool you can:
- View the full JSON Schema (
inputSchema) - Read the description and annotations
- Execute the tool manually with a built-in JSON editor
- See the result (or error) in the timeline
AI Session Threads
When LanguageModel.create() is called, the extension tracks the session. Subsequent prompt() and promptStreaming() calls are grouped by session ID, showing the full request-response thread. For streaming responses, you can see the text accumulate in real time.
Architecture: Three Worlds, One Event Stream
Chrome extensions have a unique constraint: content scripts run in an ISOLATED world that shares the DOM but not the JavaScript context of the page. The page's window.ai and navigator.modelContext objects live in the MAIN world. The DevTools panel runs in yet another context. Getting events from the page to the panel requires a three-hop relay.
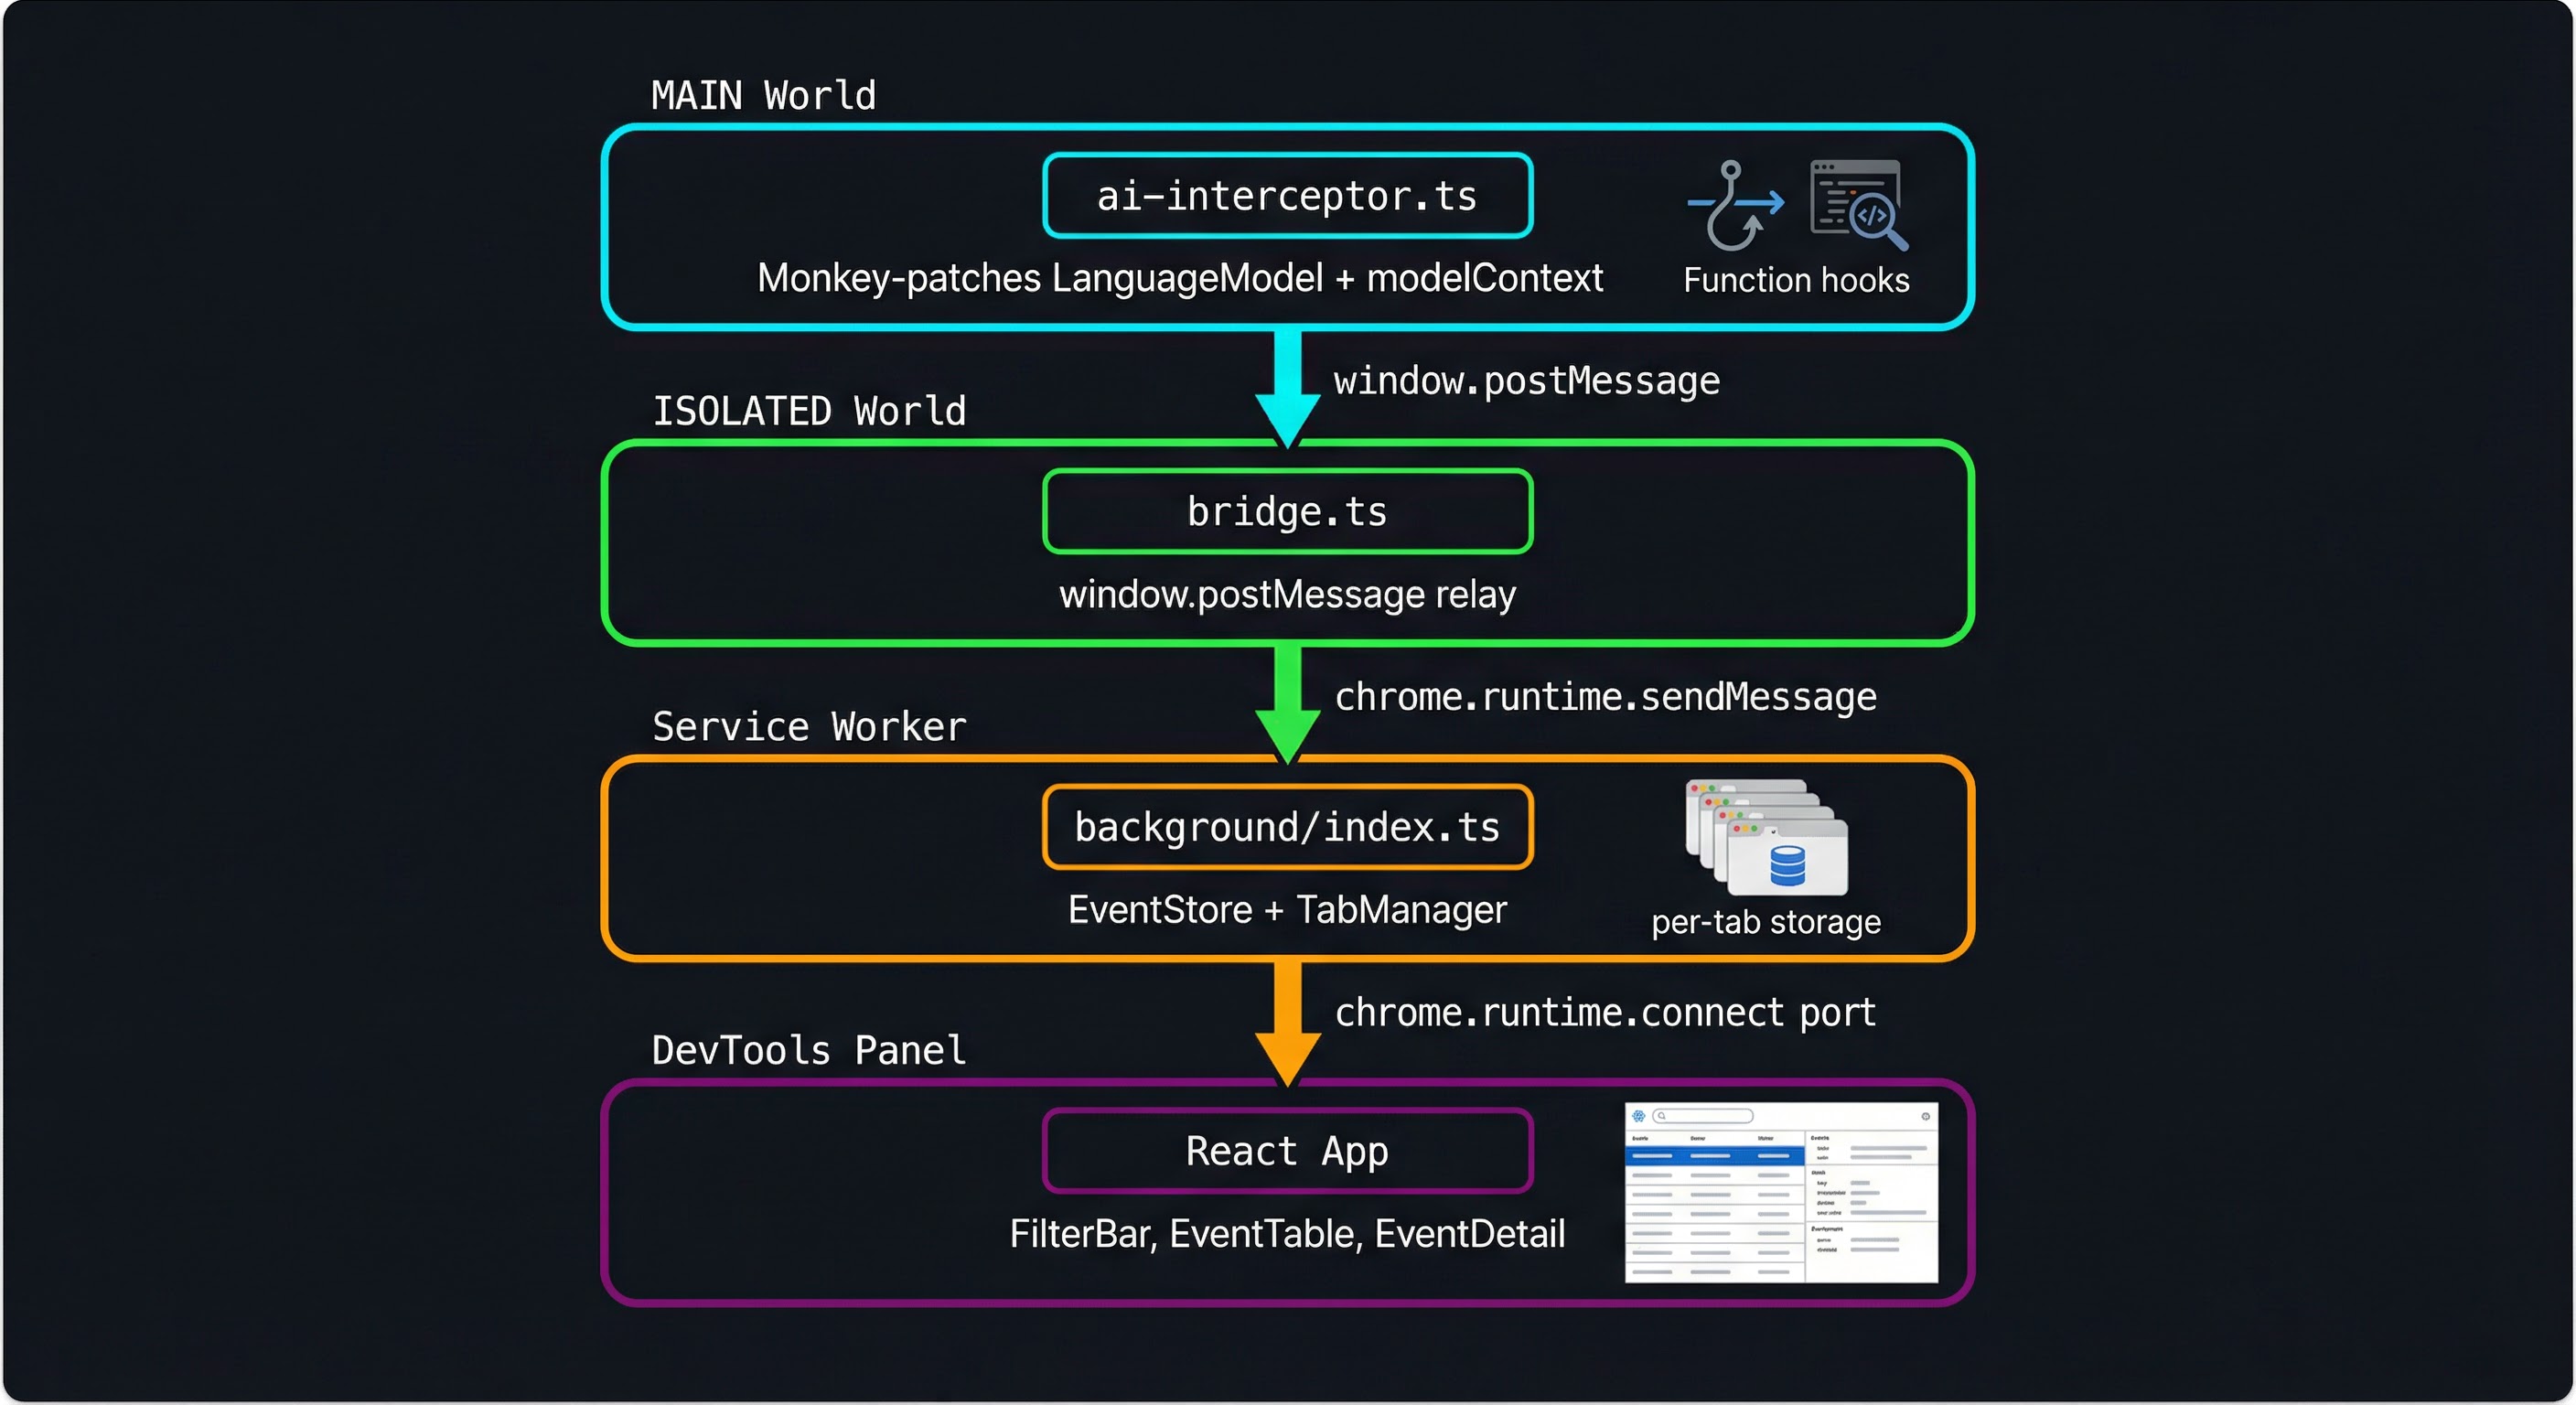
ai-interceptor.ts (MAIN world)
    │  monkey-patches LanguageModel + modelContext
    │  posts events via window.postMessage
    ▼
bridge.ts (ISOLATED world)
    │  receives postMessage events
    │  forwards via chrome.runtime.sendMessage
    ▼
background/index.ts (Service Worker)
    │  stores events in per-tab EventStore
    │  forwards to connected panels via port
    ▼
panel/src/App.tsx (DevTools Panel)
    │  React app with filter bar, event table, detail pane
    │  connected via chrome.runtime.connect port
Layer 1: The MAIN World Interceptor
The core of the extension is ai-interceptor.ts, injected into the page's MAIN world via chrome.scripting.executeScript({ world: 'MAIN' }). It monkey-patches two APIs:
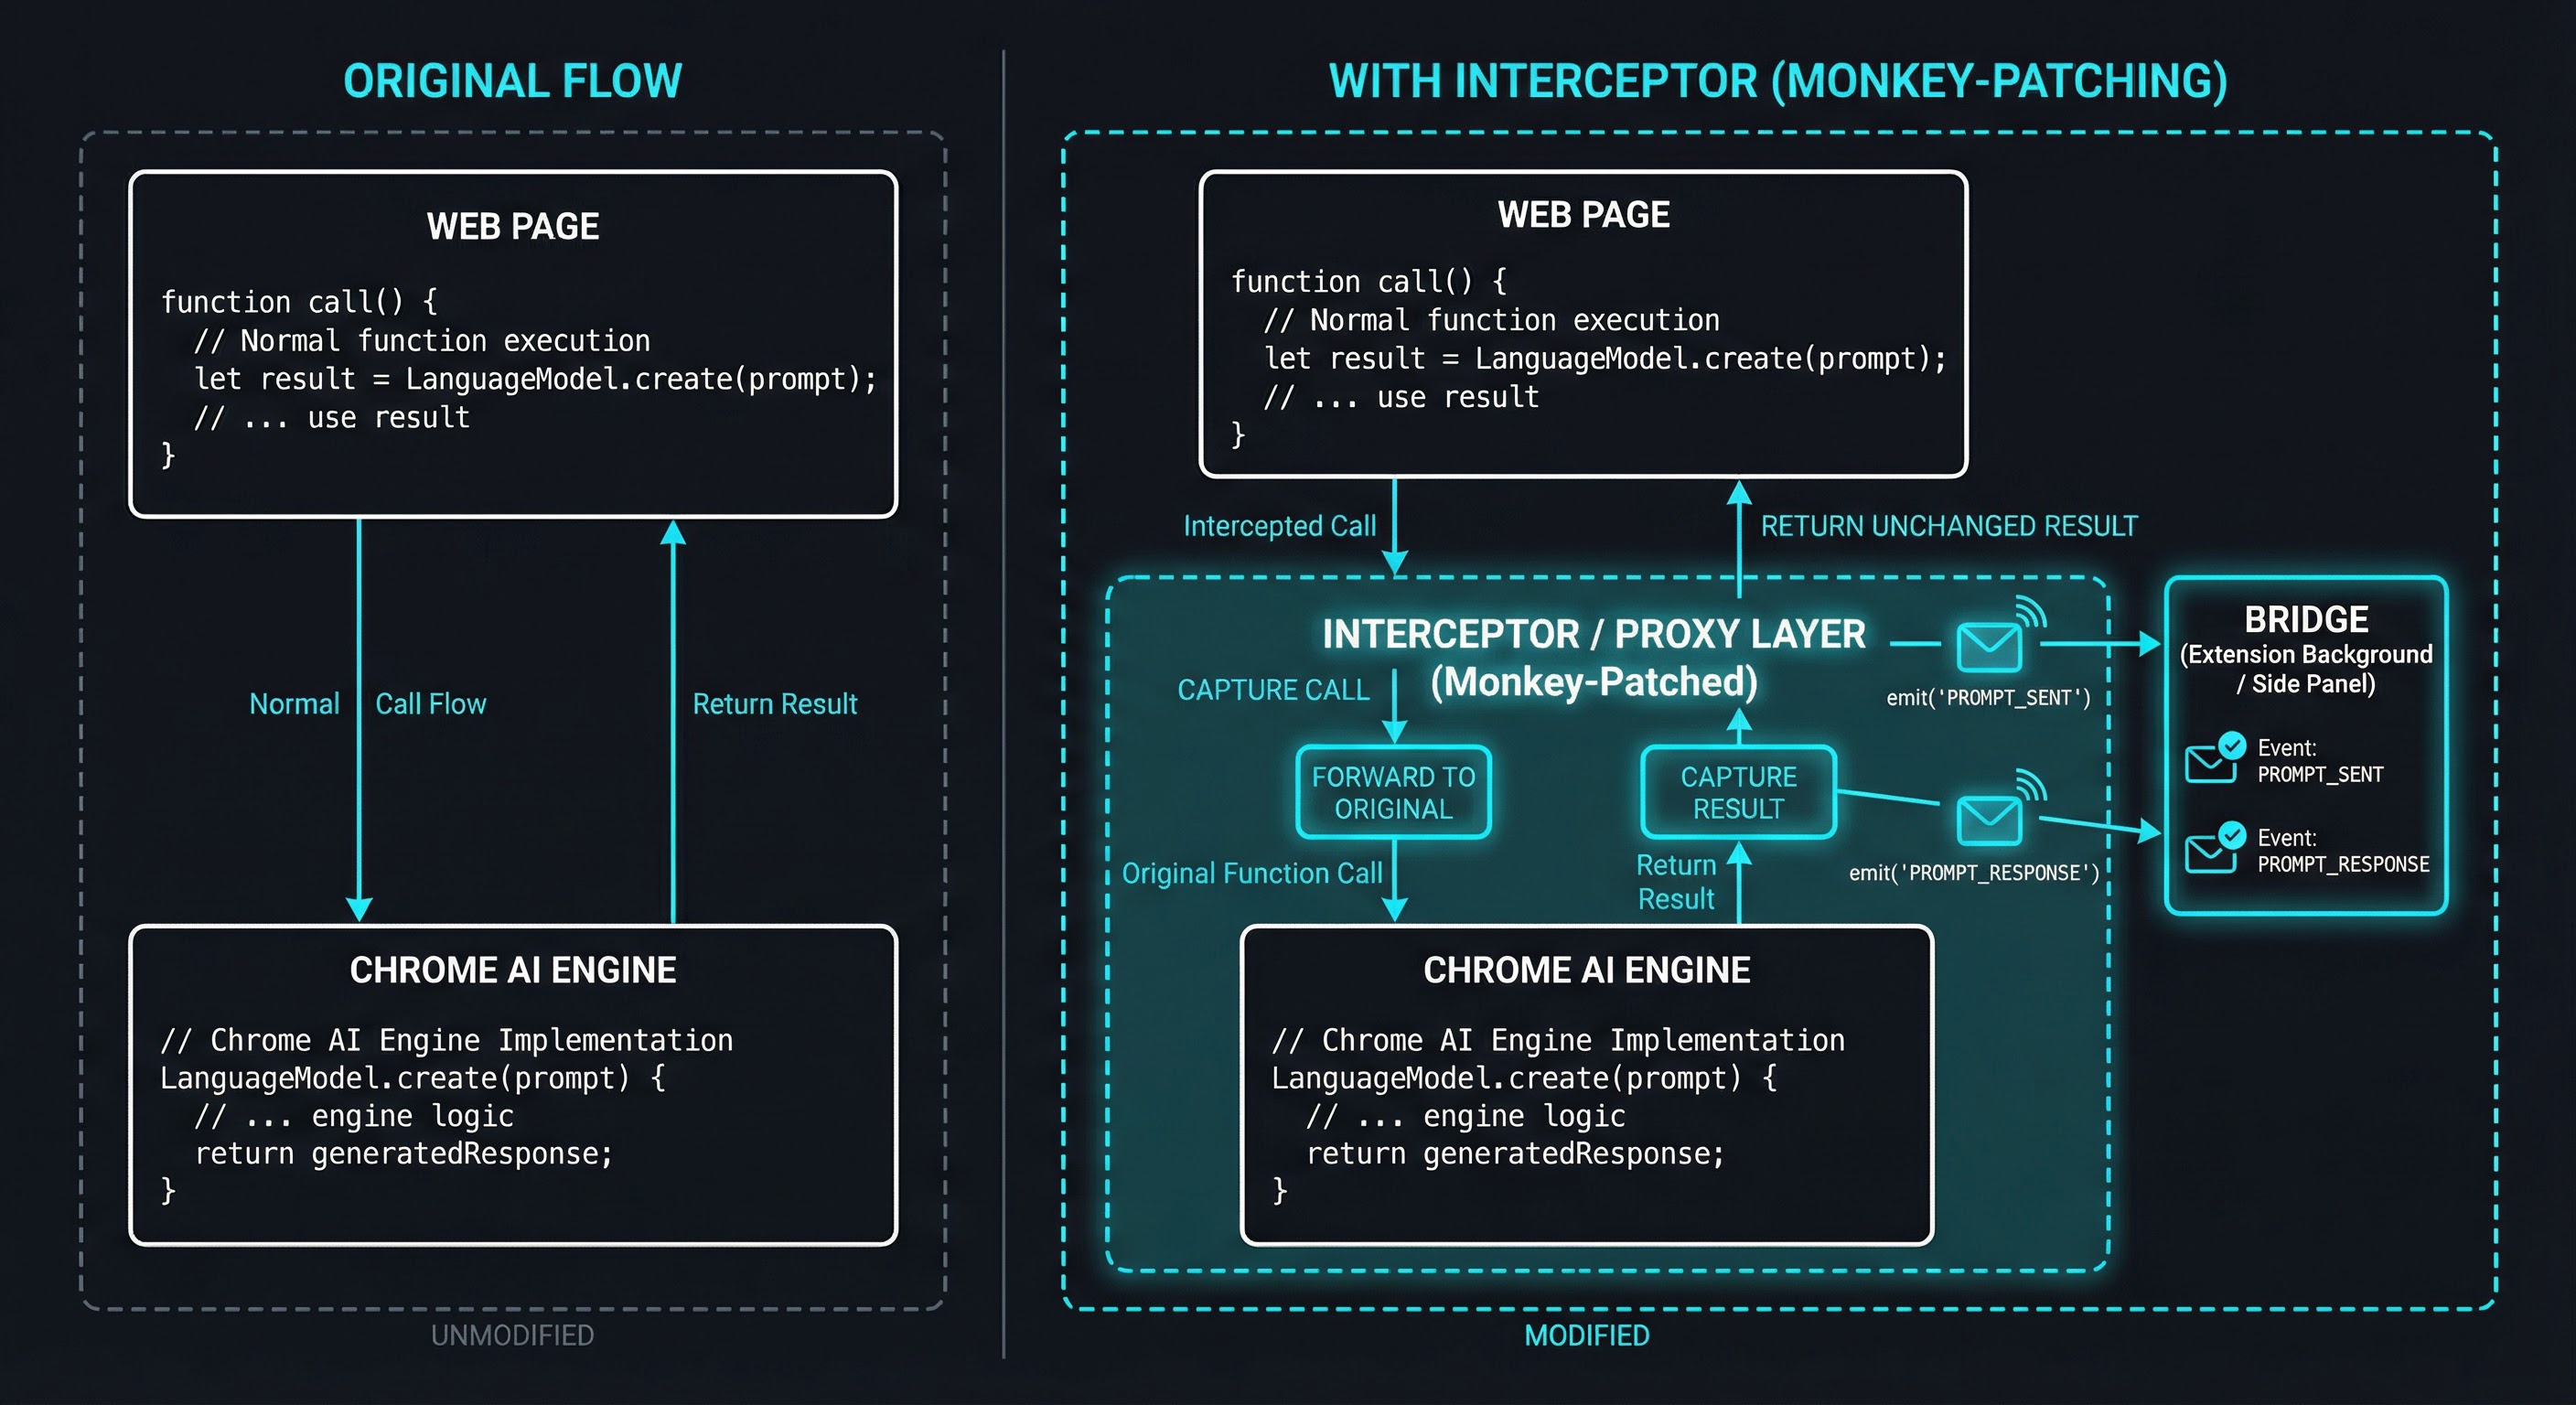
LanguageModel (window.ai)
const originalCreate = LM.create.bind(LM);
LM.create = async function (options) {
  const session = await originalCreate(options);
  const sessionId = crypto.randomUUID();

  // Wrap prompt()
  const originalPrompt = session.prompt.bind(session);
  session.prompt = async function (input, opts) {
    emit("PROMPT_SENT", { sessionId, input, opts, ts: Date.now() });
    const result = await originalPrompt(input, opts);
    emit("PROMPT_RESPONSE", { sessionId, result, ts: Date.now() });
    return result;
  };

  // Wrap promptStreaming() — returns a new ReadableStream that
  // re-emits every chunk while accumulating the full text
  // ...

  emit("SESSION_CREATED", { sessionId, options, ts: Date.now() });
  return session;
};
Every method gets wrapped with a before/after event emission. The interceptor preserves the original behavior — it calls the real function, captures the result, emits an event, and returns the result unchanged. Errors are also captured and re-thrown.
navigator.modelContext (WebMCP)
The same pattern applies to registerTool, unregisterTool, provideContext, and clearContext. One subtlety: events are emitted after calling the original function, not before. This prevents false positives — if the browser throws (e.g., duplicate tool name or invalid schema), no event is emitted.
mc.registerTool = function (toolDef) {
  const result = origRegister(wrapToolExecute(toolDef));
  emit("TOOL_REGISTERED", { tool: toolMeta(toolDef), ts: Date.now() });
  return result;
};
Tool execute callbacks get wrapped too, so the extension captures TOOL_CALL and TOOL_RESULT_AI events when an AI agent invokes a tool.
Layer 2: The ISOLATED World Bridge
The ISOLATED world content script (bridge.ts) is declared in manifest.json and runs at document_start. It does two things:
- Listens for
window.postMessageevents from the interceptor and forwards them viachrome.runtime.sendMessage - Listens for native WebMCP window events (
toolactivated,toolcancel) and forwards those too
window.addEventListener("message", (event) => {
  if (event.source !== window) return;
  if (event.data?.source !== "webmcp-debugger") return;
  forward({ source: "webmcp-debugger", type: event.data.type, data: event.data.data });
});
The bridge is intentionally thin — it doesn't transform or filter events, just relays them across the extension boundary.
Layer 3: Background Service Worker
The background script receives events from the bridge and handles three responsibilities:
Per-tab event storage. An EventStore class (backed by chrome.storage.session) maintains a separate event list for each tab. This means multiple tabs can run WebMCP independently without cross-contamination.
Panel management. A TabManager tracks which DevTools panel port is observing which tab. When an event arrives for tab 42, only the panel inspecting tab 42 receives it.
Navigation handling. When a tab navigates (chrome.tabs.onUpdated with status: "loading"), the background re-injects the MAIN world interceptor. This is necessary because navigation destroys the MAIN world context — the monkey-patches are gone. The background also emits a PAGE_RELOAD event so the panel knows to reset its tool list.
chrome.tabs.onUpdated.addListener((tabId, changeInfo) => {
  if (changeInfo.status === "loading") {
    eventStore.add(tabId, { type: "PAGE_RELOAD", ts: Date.now() });
    tabManager.notifyPanel(tabId, { type: "PAGE_RELOAD" });
    chrome.scripting.executeScript({
      target: { tabId },
      world: "MAIN",
      files: ["content/ai-interceptor.js"],
    });
  }
});
Layer 4: The DevTools Panel
The panel is a React app with Tailwind CSS, connected to the background via chrome.runtime.connect. It uses a reducer-based state management pattern (via InspectorContext) and renders three main components:
| Component | Purpose |
|---|---|
| FilterBar | Category tabs (All, Tools, Prompts, Streaming, System) + clear button |
| EventTable | Chronological list of events with type icons, timestamps, and summary |
| EventDetail | Expandable JSON view of the selected event's full payload |
| StatusBar | Connection status, event count, tool count |
The panel requests initial state (GET_STATE) when it connects, hydrating from the EventStore so you don't lose events if you open DevTools after the page has been running.
Lessons Learned Building It
MAIN vs ISOLATED World Is the Fundamental Constraint
Chrome extensions cannot directly access page JavaScript from content scripts. The content script sees the DOM but runs in a separate JavaScript context. This means you can't just import the page's LanguageModel from a content script — it doesn't exist there.
The solution is chrome.scripting.executeScript({ world: 'MAIN' }), which injects code into the page's own context. But MAIN world scripts can't use chrome.* APIs. Hence the two-layer content script architecture: MAIN world for interception, ISOLATED world for Chrome API access.
Event Ordering Matters More Than You'd Think
An early version of the interceptor emitted TOOL_REGISTERED before calling the real registerTool(). This caused a subtle bug: if the browser rejected the registration (e.g., duplicate tool name), the panel would show a tool that didn't actually exist. Emitting events only after the real call succeeds was a simple fix with a big impact.
Similarly, provideContext() in the WebMCP spec replaces the entire tool set atomically. The extension emits a CONTEXT_CLEARED event followed by individual TOOL_REGISTERED events to match the spec's semantics.
Badge Accuracy Requires Derived State
A naive badge implementation counted TOOL_REGISTERED events. But tools can be unregistered, context can be cleared, and pages can reload. The correct approach is to derive the current tool set from the full event history — replaying registrations, unregistrations, and clears to arrive at the current state.
Streaming Needs Accumulation, Not Replacement
The promptStreaming() wrapper reads chunks from the original ReadableStream and re-emits them through a new stream. An early bug used fullText = value instead of fullText += value, which meant the STREAM_END event only contained the last chunk instead of the full accumulated text.
How to Use It
Prerequisites
- Chrome 146+ (currently Canary) with the following flags enabled:
chrome://flags/#webmcp-testing— enablesnavigator.modelContextchrome://flags/#optimization-guide-on-device-model— enableswindow.ai(Gemini Nano)
Install
git clone https://github.com/tech-sumit/webmcp-debugger-chrome-extension.git
cd webmcp-debugger-chrome-extension
pnpm install && pnpm build
Then in Chrome:
- Open
chrome://extensions/ - Enable Developer mode
- Click Load unpacked and select the
dist/directory
Use
- Navigate to any page that uses
window.aiornavigator.modelContext - Open Chrome DevTools (F12)
- Find the WebMCP Debugger panel tab
- Watch events flow in as the page interacts with AI APIs
You can also use the extension's badge — it shows the number of currently registered WebMCP tools for the active tab.
Tech Stack
| Layer | Technology |
|---|---|
| Panel UI | React 19, Tailwind CSS 3.4 |
| Build | Vite 6 (four separate configs for panel, bridge, interceptor, background) |
| Language | TypeScript 5.6 |
| Extension | Manifest V3 |
| Testing | Vitest |
| Linting | ESLint 9 + TypeScript parser |
| Package manager | pnpm |
The build system uses four Vite configs because Chrome extensions need different output formats: the panel is a standard SPA, the content scripts are IIFEs, and the background is a service worker module. A single pnpm build runs all four sequentially and copies the manifest.
What's Next
WebMCP is still behind a flag in Chrome Canary, but the W3C specification is actively developing. As more sites adopt WebMCP tools and the Prompt API matures, developer tooling becomes critical. A few directions I'm exploring:
- Request/response matching — linking
PROMPT_SENTto itsPROMPT_RESPONSE(or error) in the timeline for clearer debugging - Tool execution playground — a standalone mode for testing WebMCP tools without needing an AI agent
- Export and replay — save event traces and replay them for testing or sharing bug reports
- Performance overlay — visualize prompt latency and streaming throughput
If you're building with WebMCP or window.ai, give the extension a try and open an issue if you hit a rough edge. PRs are welcome.